One of the first pieces of test equipment I decided to build was a QRP dummy load.
The first one was just twenty 1k 1/2 watt resistors on perf-board. I added a diode RF detector and used a DVM and a conversion table to measure power output. Looking at the formula for voltage vs. power and the resulting table, it looked like it would only take a voltage divider to scale down to 5 volts max for an Arduino analog input.
![]()
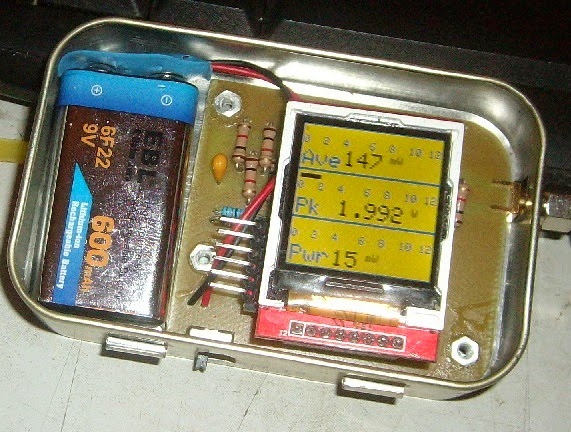
I had recently tested a 128 x 128 pixel color TFT display that interfaced with an Arduino Pro-Mini without having to use level conversion. I designed and etched a small circuit board, that fit in an Altoids tin along with a 9 volt battery.
![]()
![]() With a 128 pixel wide display and a dummy load that should handle 10 watts continuously, I decided to go with a 12 watt scale. From the tables I found that 20 watts would give me a peak voltage of just under 45 volts. Giving a good safety factor I used a voltage divider ratio of 11 for the Arduino input. The detector diode I used is also rated at 45 volts, so everything should be fine up to about 20 watts peak. During testing I did blow a couple of diodes when I went over about 25 watts on voice peaks, but the Arduino was not damaged.
With a 128 pixel wide display and a dummy load that should handle 10 watts continuously, I decided to go with a 12 watt scale. From the tables I found that 20 watts would give me a peak voltage of just under 45 volts. Giving a good safety factor I used a voltage divider ratio of 11 for the Arduino input. The detector diode I used is also rated at 45 volts, so everything should be fine up to about 20 watts peak. During testing I did blow a couple of diodes when I went over about 25 watts on voice peaks, but the Arduino was not damaged.
To make it easier to use while aligning equipment I wanted a bar graph display along with the digital readout. To indicate that the power is over the rating of the load I change to color of the bar graph to red when over 10 watts. Under 1 watt I display the power in mw. and in watts over 1 watt. After scaling to the screen, I found I also had room for Peak and Average power readings. To reduce digit bobble on the power reading I take the average of the last 8 readings, for the Average value I use the last 64 readings. The average and peak values are reset after about 10 seconds of no power input.
For anyone who wants to build one, I put a copy of the schematic, board artwork and Arduino code in a public dropbox folder.
https://www.dropbox.com/sh/zfexs3k8a1v9fqb/AACR5BsopnK7m7u3QJW6JONxa?dl=0
5/4/15 UPDATE TO SKETCH IN DROP-BOX TO CHANGE ADC CONVERSION MAPPING
The first one was just twenty 1k 1/2 watt resistors on perf-board. I added a diode RF detector and used a DVM and a conversion table to measure power output. Looking at the formula for voltage vs. power and the resulting table, it looked like it would only take a voltage divider to scale down to 5 volts max for an Arduino analog input.

I had recently tested a 128 x 128 pixel color TFT display that interfaced with an Arduino Pro-Mini without having to use level conversion. I designed and etched a small circuit board, that fit in an Altoids tin along with a 9 volt battery.

 With a 128 pixel wide display and a dummy load that should handle 10 watts continuously, I decided to go with a 12 watt scale. From the tables I found that 20 watts would give me a peak voltage of just under 45 volts. Giving a good safety factor I used a voltage divider ratio of 11 for the Arduino input. The detector diode I used is also rated at 45 volts, so everything should be fine up to about 20 watts peak. During testing I did blow a couple of diodes when I went over about 25 watts on voice peaks, but the Arduino was not damaged.
To make it easier to use while aligning equipment I wanted a bar graph display along with the digital readout. To indicate that the power is over the rating of the load I change to color of the bar graph to red when over 10 watts. Under 1 watt I display the power in mw. and in watts over 1 watt. After scaling to the screen, I found I also had room for Peak and Average power readings. To reduce digit bobble on the power reading I take the average of the last 8 readings, for the Average value I use the last 64 readings. The average and peak values are reset after about 10 seconds of no power input.
For anyone who wants to build one, I put a copy of the schematic, board artwork and Arduino code in a public dropbox folder.
https://www.dropbox.com/sh/zfexs3k8a1v9fqb/AACR5BsopnK7m7u3QJW6JONxa?dl=0
5/4/15 UPDATE TO SKETCH IN DROP-BOX TO CHANGE ADC CONVERSION MAPPING